Houston Hotness Chart
Real Estate Hotness Chart
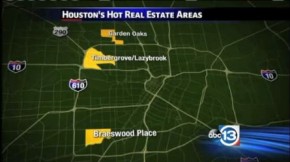
Channel 13 recently aired a piece on Houston’s hot real estate market. Of course everybody knows that our real esate market is hot, and everybody is talking about it, but they went one step more show and showed a Hotness Chart. This chart that shows relative “hotness” of different areas. I know, it sounds more like a bikini contest scoring system than a real estate chart, but everything has to be sexy these days. This chart ranks neighborhoods on a scale of 0 to 90. Zero being “not hot” to 90 being the hottest.
Being analytical, I love charts. Everyone likes to see how their neighborhood compares to others. Garden Oaks, Timbergrove/Lazybrook ranked the highest at 80+. Katy-Southeast was next, followed by Lomax (wherever that is). Anyway click on this link for the “Hotness Chart” or here to see the story on KTRK video.
Actually the whole thing is kind of silly because the score isn’t defined. Garden Oaks and Timbergrove area are definitely hot, but a more meaningful score would be Days on Market (DOM). For instance Garden Oaks had 31 sales in the last 90 days (my data not KTRH). The average DOM was 31, but half of these sold within 10 days. That’s a more meaningful number. Oak Forest had 114 sales, average DOM was 30, and again half sold in 10 days (many within 2-3 days). The typical DOM for these areas for the last year has been 90 days, so 30 days is remarkable.
On the other end of the spectrum was Tiki Island, ranking just under 10 on the scale. It’s average Days on Market for last 90 days was 234 (7.2 months). This is slow compared to everywhere else, but not horribe. It used to be an average DOM was 5-7 months. Below this was a sellers’ market. Above that was a buyer’s market.
Anyway, check it out. The purpose of a chart is simplicity…quick and easy. This one definitely is.


