2012 Neighborhood Price Trends

Neighborhood Price Trends – Close-In Neighborhoods
Neighborhood Price Trends
The Houston Chronicle just released it’s annual Price Trends Survey of 2012 for Houston home sales. The link allows you to search by part of town, subdivision name etc. So if you are interested in other parts of town, check out the Chronicle.
I live in the Heights and sell homes here and other close-in Northside subdivisions, so these are the ones I have reproduced. The heights is a complicated area. I will cover it in my next post. Subscribe in the side bar so you don’t miss it.
It’s always interesting to see which areas appreciated and which depreciated. The areas inside Houston’s 610 loop and close-in areas generally do well. The “thinly traded” ones, or odd locations may not do as well.
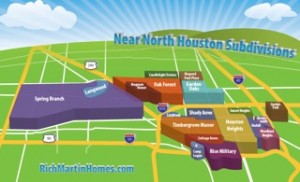
Here they are; read ‘em and weep or congratulate yourself for having chosen your neighborhood so well. The links in the post go to my Neighborhood Pages, also found in toolbar above. If you don’t know where these are see my Interactive Map of Neighborhoods.
|
Subdivision |
Typical Price Range |
$ Per |
$ Per |
% Change |
Homes Sold 2012 |
Total in Subdiv. |
% |
|
$190-550K |
$168 |
$169 |
+0.3% |
81 |
1405 |
7% |
|
|
$130-510K |
$139 |
$166 |
+19.9% |
333 |
5489 |
12% |
|
|
Shepherd Park Plaza |
$240-370K |
$124 |
$136 |
+9.2% |
26 |
727 |
0% |
|
Shepherd Forest |
$110-220K |
$130 |
$112 |
-13.3% |
36 |
917 |
0% |
|
Mangum Manor |
$120-210K |
$101 |
$97 |
-3.9% |
17 |
412 |
0% |
|
$220-430K |
$164 |
$177 |
+7.9% |
106 |
1545 |
4% |
|
|
$210-410K |
$156 |
$179 |
+15.0% |
36 |
666 |
1% |
|
|
$91-200K |
$115 |
$104 |
-9.7% |
19 |
1086 |
0% |
|
|
$150-330K |
$122 |
$136 |
+11.8% |
112 |
862 |
62% |
|
|
$170-390K |
$139 |
$146 |
+5.3% |
38 |
454 |
53% |
The headings above are pretty self-explanatory. What isn’t sellf-explanatory though is how to use the data. Do not use the data to show that the value of your Oak Forest home went up by 20%. Yes, the median price increased by almost this amount, but that may mean that the median house size has gone up too. All those new homes being built are not little bungalows. So, it shows trends (+ is better than -) but that’s about it.
The median price per SF doesn’t mean much either by itself. This lumps together new homes, remodeled homes and tear-downs. Again, this is good for is for trends and comparing one subdivision to another.
Oak Forest is having strong sales growth. Remodels and new construction homes are booming there.
The three areas that showed declining values are Mangum Manor, Shepherd Forest and Lindale Park.
Shepherd Forest is that narrow strip between the 610 Loop and W34th St. Just not the most fortuitous location.
Mangum Manor I believe is just under-appreciated. It has nice homes, reasonably priced.
Lindale Park is a different story. There have just been few homes for sale in the last year or so. See my last couple of posts on Lindale Park. There are typically a few tear-downs for sale and a few gorgeous homes for sale. Unfortunately lately there have been very few really nice homes on the market. People are holding on to them. So, it’s not a matter of declining values (they are not declining!) just very few high end homes on the market. This is still one of my picks for under-appreciated neighborhoods.
Missing from the Chronicle 2012 Neighborhood Price Trends is Near Northside (or Northside Village). It is just East of the Heights and below Lindale Park. An area that will be helped by the light rail.
One last note: Most of the neighborhoods above are well maintained cohesive neighborhoods. The two exceptions are Shady Acres (just below the 610 Loop, West of Shepherd) and Cottage Grove (West of Shepherd, straddling I-10). These are odd areas. Where most neighborhoods have a lot of renovations in progress, these two areas don’t. In general the little homes here aren’t worth the remodel investment, and the lots are so big they are ideal for tear-downs and putting up multiple new homes. The % of new homes tells the story, 50-60% new homes. A great place to buy new homes at a decent price…not a place to look for a cute renovated bungalow.
My next post will cover Neighborhood Price Trends for the Heights.